
Visualising data can help you bring the stories behind the data to life, making it more relevant for your audience and enabling better business decisions through insights and implications you might have missed otherwise.
Power BI enables you to visualise and analyse data for business intelligence (BI) easily. This versatile tool and allows you to create custom reports, track significant metrics, ask questions about your data, and uncover hidden information; thus, delivering timely and relevant business insights so that you can stay on top of all your data without having to employ a team of data scientists.
Let’s explore how a powerful tool such as Microsoft Power BI can help you make sense of your complex business data and drive strategic decision-making with its data visualisation capabilities.
1. Use Data from multiple/existing sources
Power BI can take data from multiple sources and third-party tools and apps, whether they are on the cloud or on-premises, – with a few clicks. In other words, you can integrate your data visuals into a custom dashboard and monitor and analyse key metrics conveniently to meet the needs of your organisation and be able to see the data that affects you right away.
2. Get Answers to Your Data Questions
Power BI lets you ask questions about the data, making it easier to get the insights you should be looking at. Your question can either be general, allowing Power BI to make the decision on which visualisation would be best, or specific enough to generate the exact visual you’re envisioning. The platform can also suggest questions based on your data to help you gain the perspective you need.
3. Be Your Own Data Scientist
With the low/no-code nature of Power BI, you can be your own data scientist thanks to machine learning to discover contributing factors, and analysis through features such as decomposition trees, anomaly detection and Smart Narrative that let your data tell a story. For instance, if you could identify the reasons behind product backorder, you could implement measures to improve the customer service you provide and resolve issues quicker.
4. Automate Data Preparation and Enrichment
Power BI can also save you a lot of time and effort by automatically preparing and enriching your data using AI machine learning, and providing you predictions at the same time. As a result, you can be prepared for likely fluctuations, shortages, changing conditions or other eventualities, giving you a leg up on your competition and helping you stay ahead of the game. In addition, with Azure automated machine learning (AutoML) integrated with Power BI, you can harness these capabilities without a separate Azure subscription – an excellent value for any business.
5. Combine Power BI with Power Apps
What if you could automate actions based on the conclusions from your data without having to spend hours discussing them in meetings?
By combining Power BI with Power Apps, you can go from data to action without much additional work and automatically create workflows, break them into actionable steps, and input those steps into work orders; thus, saving precious time and resources.
6. Simplify Executive Dashboards
With Power BI, you can simplify complex reports and dashboards into an easy-to-follow display of trends and overall movement towards your overarching goal. As a results, you and other executives can determine whether things are going in the right direction at a glance and take a deeper dive into the numbers if needed.
Power BI in Action at Enlighten
Recently, Enlighten Designs’ Marketing team needed to record, track, and share new social metrics internally that were not being reported at a team level.
While Excel is usually sufficient for a quick report, Marketing Specialist Madiha Ahmed realised she needed something that was more engaging than a one-time picture depicted in some simple charts. Her aim was to show the impact of their recent campaigns on the business, by monitoring metrics such as the social index data for key sales people within the organisation. And Power BI’s intuitive and interactive visuals were just what she needed!
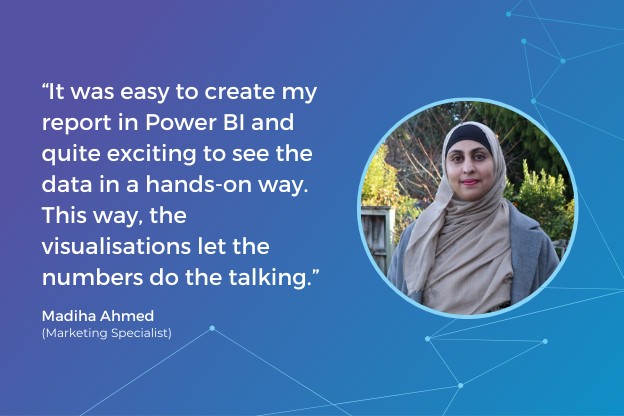
With just a little help from our amazing Power Platform team, she was able to create an interactive report that allows her - and her colleagues - to explore and monitor the data in new ways, providing a fresh perspective on the efforts of the Marketing team as well as being able to drill down into the kind of activities that are most productive in growing Enlighten’s sales funnel.
Bottom Line
What Madiha is doing is just the tip of the iceberg. The possibilities of what you - and Enlighten Designs - can achieve with your data and Power BI are endless.