The Problem
Amedisys wanted deeper insights into its sales team’s performance. The sales team sells Amedisys’ services to hospices and consumers in need of home healthcare. A dedicated team of analysts had compiled colour-coded Excel reports to track salespeople’s activities, including sales calls, the territories they cover, and how many accounts they cover.
However, that system wasn’t giving the company the data analytics they needed to understand sales performance in aggregate or individually in the best way. Amedisys wanted to utilise Power BI reports for a better user experience; Power BI would enable them to look at the report at a glance and identify what they needed to know. They didn’t have the resources or skills to do that on their own, though.
Enlighten: Leveraging Power BI for a Better Reporting Experience
Amedisys turned to Enlighten to improve the UX of its data analytics reporting experience. Enlighten offered data visualisation skills and experience, as well as Power BI capabilities; the development team at Enlighten could show Amedisys exactly what was possible with Power BI’s data visualisations. Additionally, Enlighten could collaborate with the Amedisys team in a way that complemented the healthcare provider’s strong Excel skills. When Enlighten works on a data visualisation in Power BI, the Amedisys team understands how Enlighten created the visualisation and how they can support it.
The healthcare services provider’s team of analysts created a proof-of-concept to identify and visualise critical metrics to help decision-makers. They had built some reporting based on that POC in Power BI. Their goal was to use Power BI as a centralised reporting location to share information with sales teams, who are spread out in the fields.
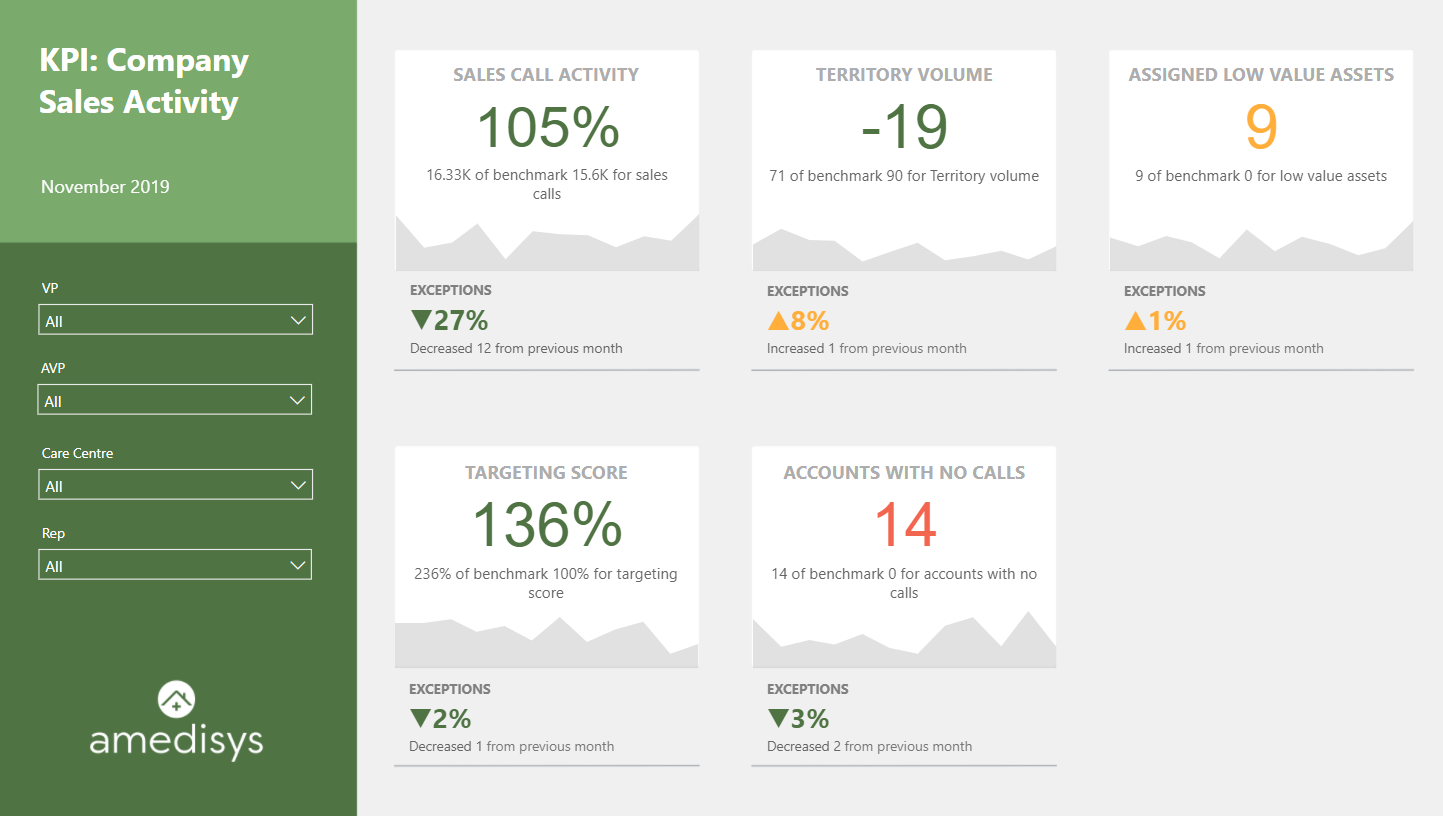
Enlighten pulls Amedisys’ data into beautiful dashboards.
Amedisys has identified a collection of KPIs that it believes offers insight into sales team member performance. With that information, Enlighten has been able to build out at-a-glance reporting. Matt Cairns, a senior developer at Enlighten, noted it’s easy to find important information in Power BI reports – they’re simpler to read than Amedisys’ previous spreadsheets.
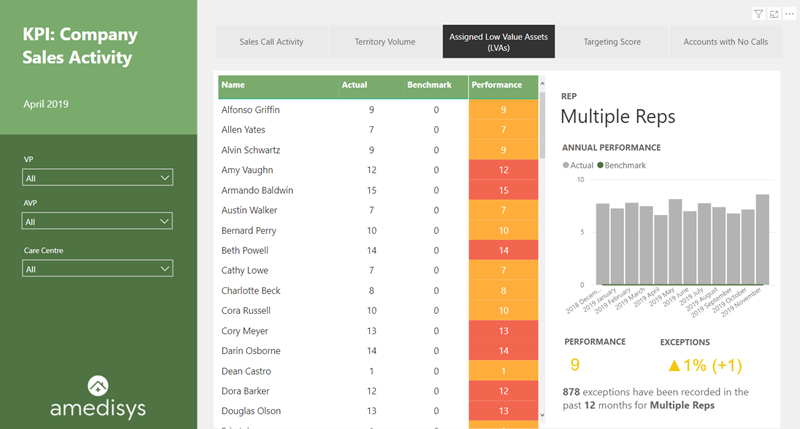
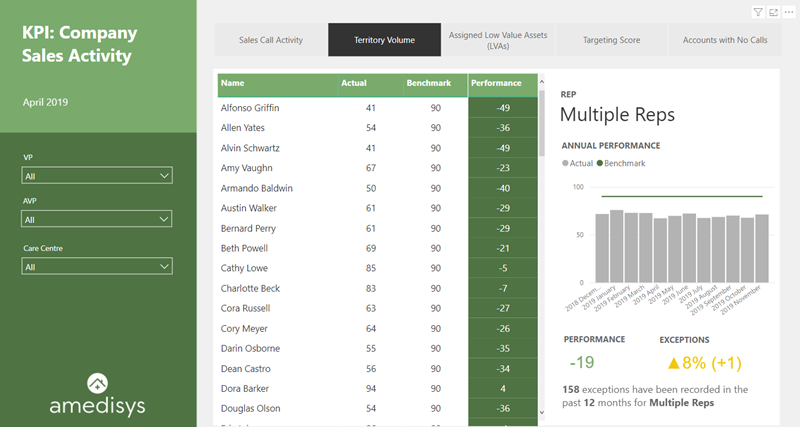
Decision-makers at Amedisys wanted to see data analytics for all sales representatives on a single page. Enlighten created a tabular reporting format that shows all salespeople for a particular KPI. This drill-down capacity gives analysts a deeper understanding of sales rep performance, so they can create an individualised plan to improve performance or reward high performers.
Results
Matt recounted that Amedisys’ results have been positive. The healthcare services provider has taken a measured approach to rolling out enhanced reporting. Analysts’ responses have been positive – they appreciate the deeper insight they have into data analytics.
Moreover, Amedisys has strengthened reporting capabilities. The analyst team has increased its own expertise in reporting and generating data visualisations within Power BI.
Implement Power BI with Enlighten
For over two decades, Enlighten has delivered amazing digital experiences to its customers. We’re a proud Microsoft partner with expertise in Power BI. Our skills and knowledge can help you get more from your data. To learn more, Contact Us.